


How to perform website load testing with JMeter and Visualize data using InfluxDB and Grafana


Hi there,
Being a developer can be both challenging and stressful, the joy however of every developer is building a usable product that is loved by the users. However, if your app or website becomes unstable and does not perform well under heavy load, you might lose the users as quickly as you gained them.
To avoid this, we do load testing. Load testing gives you the opportunity to gain insights into how your website or app will perform when it comes under heavy use. With this information, you will understand how effectively to optimize your application for such traffic.
Let's get right to it.
The tools we will need here include.
Apache JMeter - An open-source tool for Load testing apps, websites or APIs. This is the most important tool for this purpose, although viewing information directly on it might not be so easy, integrations with other data visualization tools make it much better. Click here to download
InfluxDB - Is a simple SQL database that has an integration with JMeter and will provide a means through which we will persist the data generated by JMeter with can later be read by database queries. Click here to download
Grafana - An excellent graphing tool that reads data from a varying number of sources and InfluxDB is one of them. Click here to download
So here is a diagrammatic representation of what will be accomplished in this article.

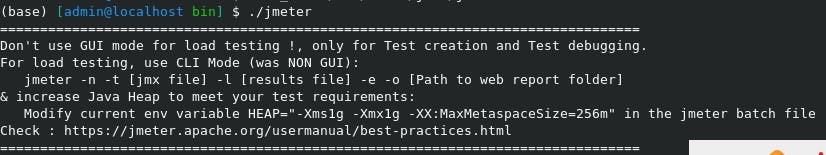
Now, let's run JMeter.
If you have it downloaded the package, usually a .tgz file, unzip and run the required binary for your operating system. In my case, i use linux,
Now, let's go through this step-wise,
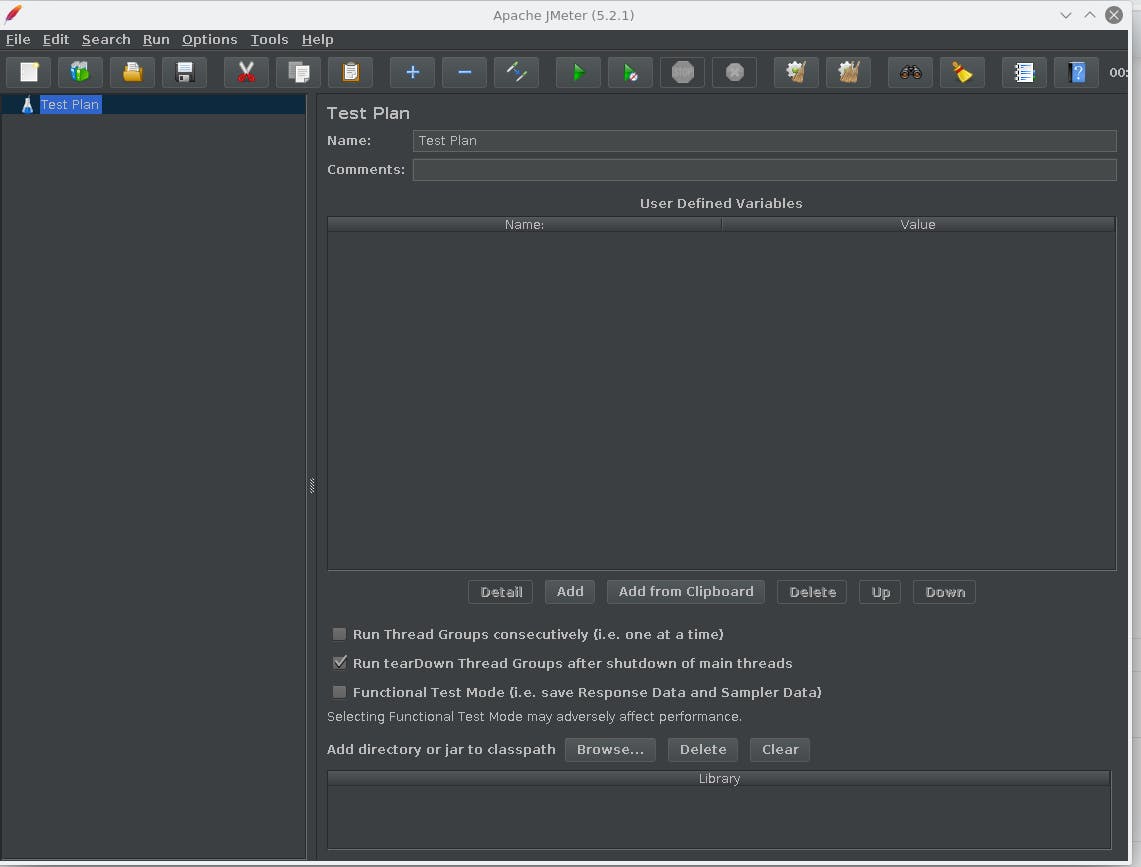
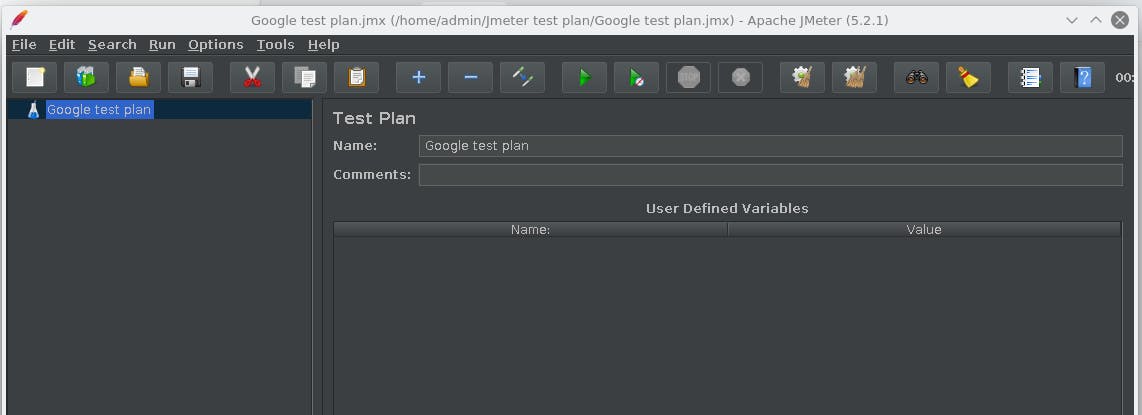
STEP 1: Create a test plan, give it a name.
STEP 2: Right-click on the test plan to add a thread group (users)
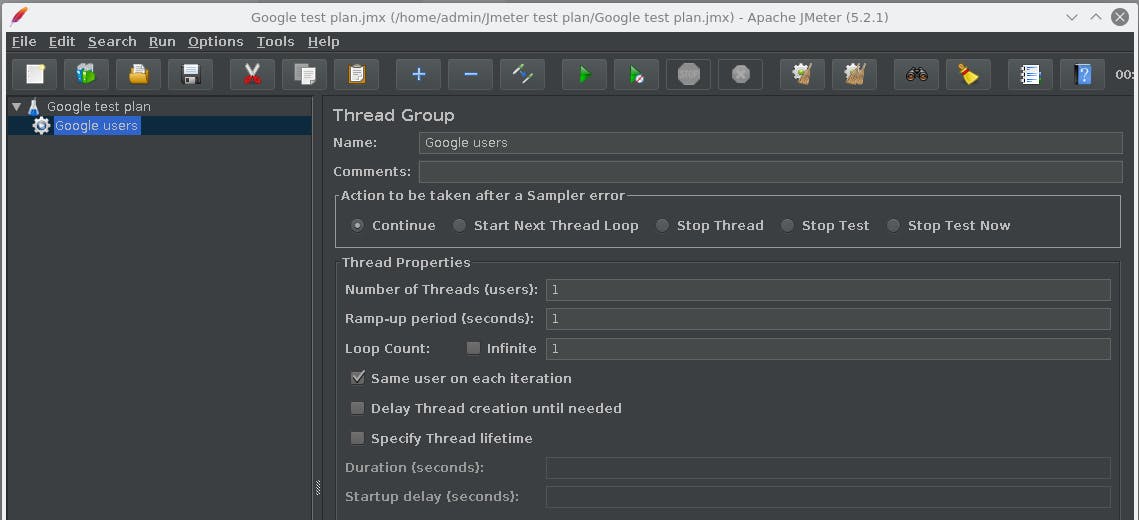
Under the thread properties section, fill in the number of threads i.e. the number of users you want your load test to simulate. Ramp-up period is the amount of time you want the test to wait before adding another user (or thread) to the request. The loop count is how many times a single user needs to make requests. Other parameters are explanatory.
STEP 3: Next, is to add a config element, called 'HTTP Request Default' this does not need to contain any value if you have no defaults to set.
STEP 4: You can also add the HTTP Cookie manager to add cookies.
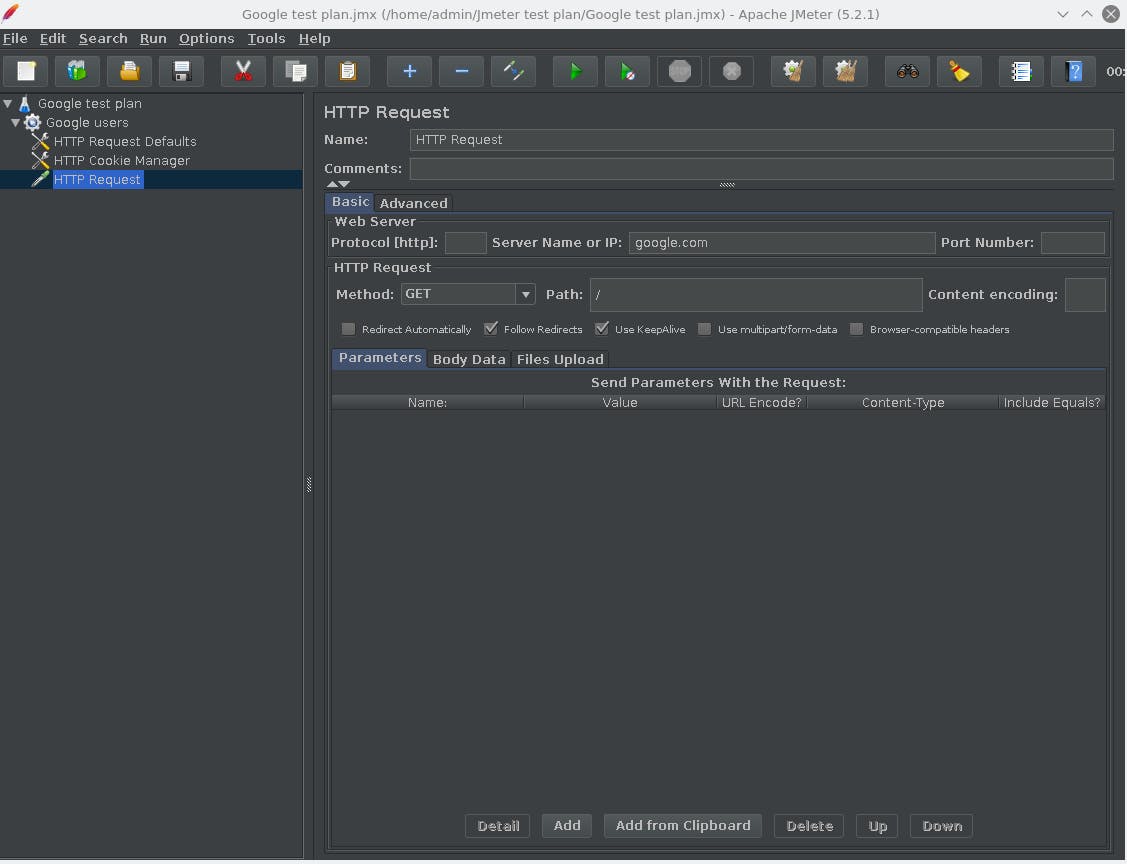
STEP 5: Now, you can add a 'sampler'. In this case, 'HTTP Request'. Here you can type in the IP or URL to the specific page(s) you want to test. If you need to test more than one page, you can add as many samplers as you would like.
NOTE: All thread groups will make requests on all the sampler you add. Hence if you have two samplers (HTTP request or any other type of request), and 200 users, that would mean 2 requests per user, hence, 400 requests.
STEP 6: Add a backend listener. Right-click on the thread group again and add > Listener > Backend Listener. In the 'backend listener implementation' select the option with influx DB. Now make the following setting.
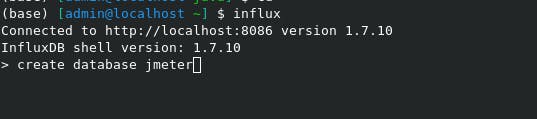
influxdbUrl: localhost:8086/write?db=jmeter
The default port for influx DB is 8086. If you changed it, you can replace the 8086 to your influx DB port. Also if you notice the query parameter 'db=jmeter', that means you will need to create a database influx DB with the name JMeter. Here's how it's done in the terminal.
STEP 7: Double-check all configurations JMeter. You may also want to double-check all configurations to make sure that they are all correct.
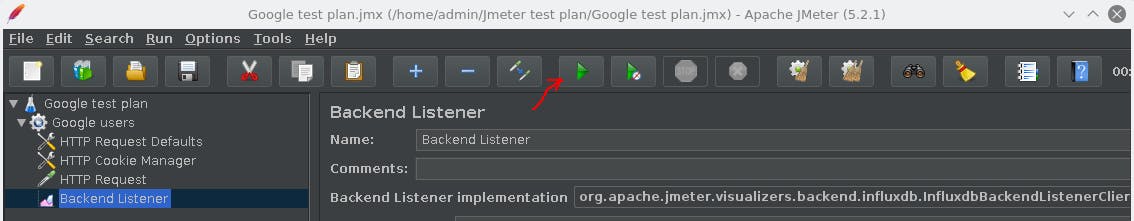
STEP 8: Run the test. There is a green play button at the top toolbar for running the test.
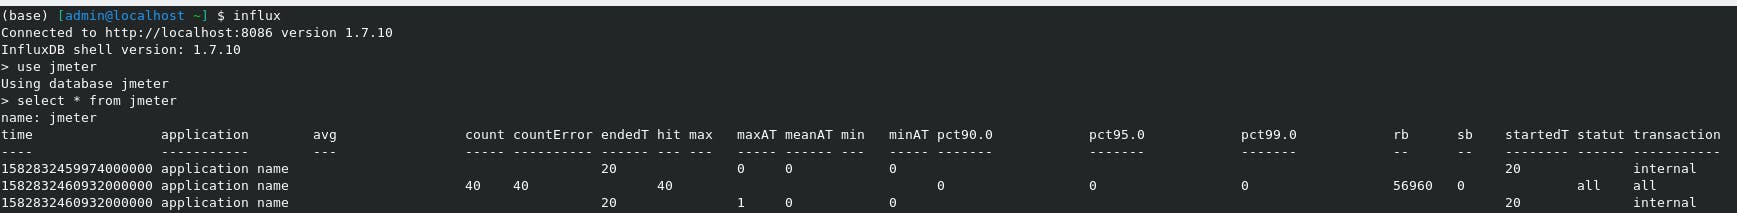
STEP 9: If successful, all your test information will now be saved in influx DB. You can look this up in the terminal to confirm.
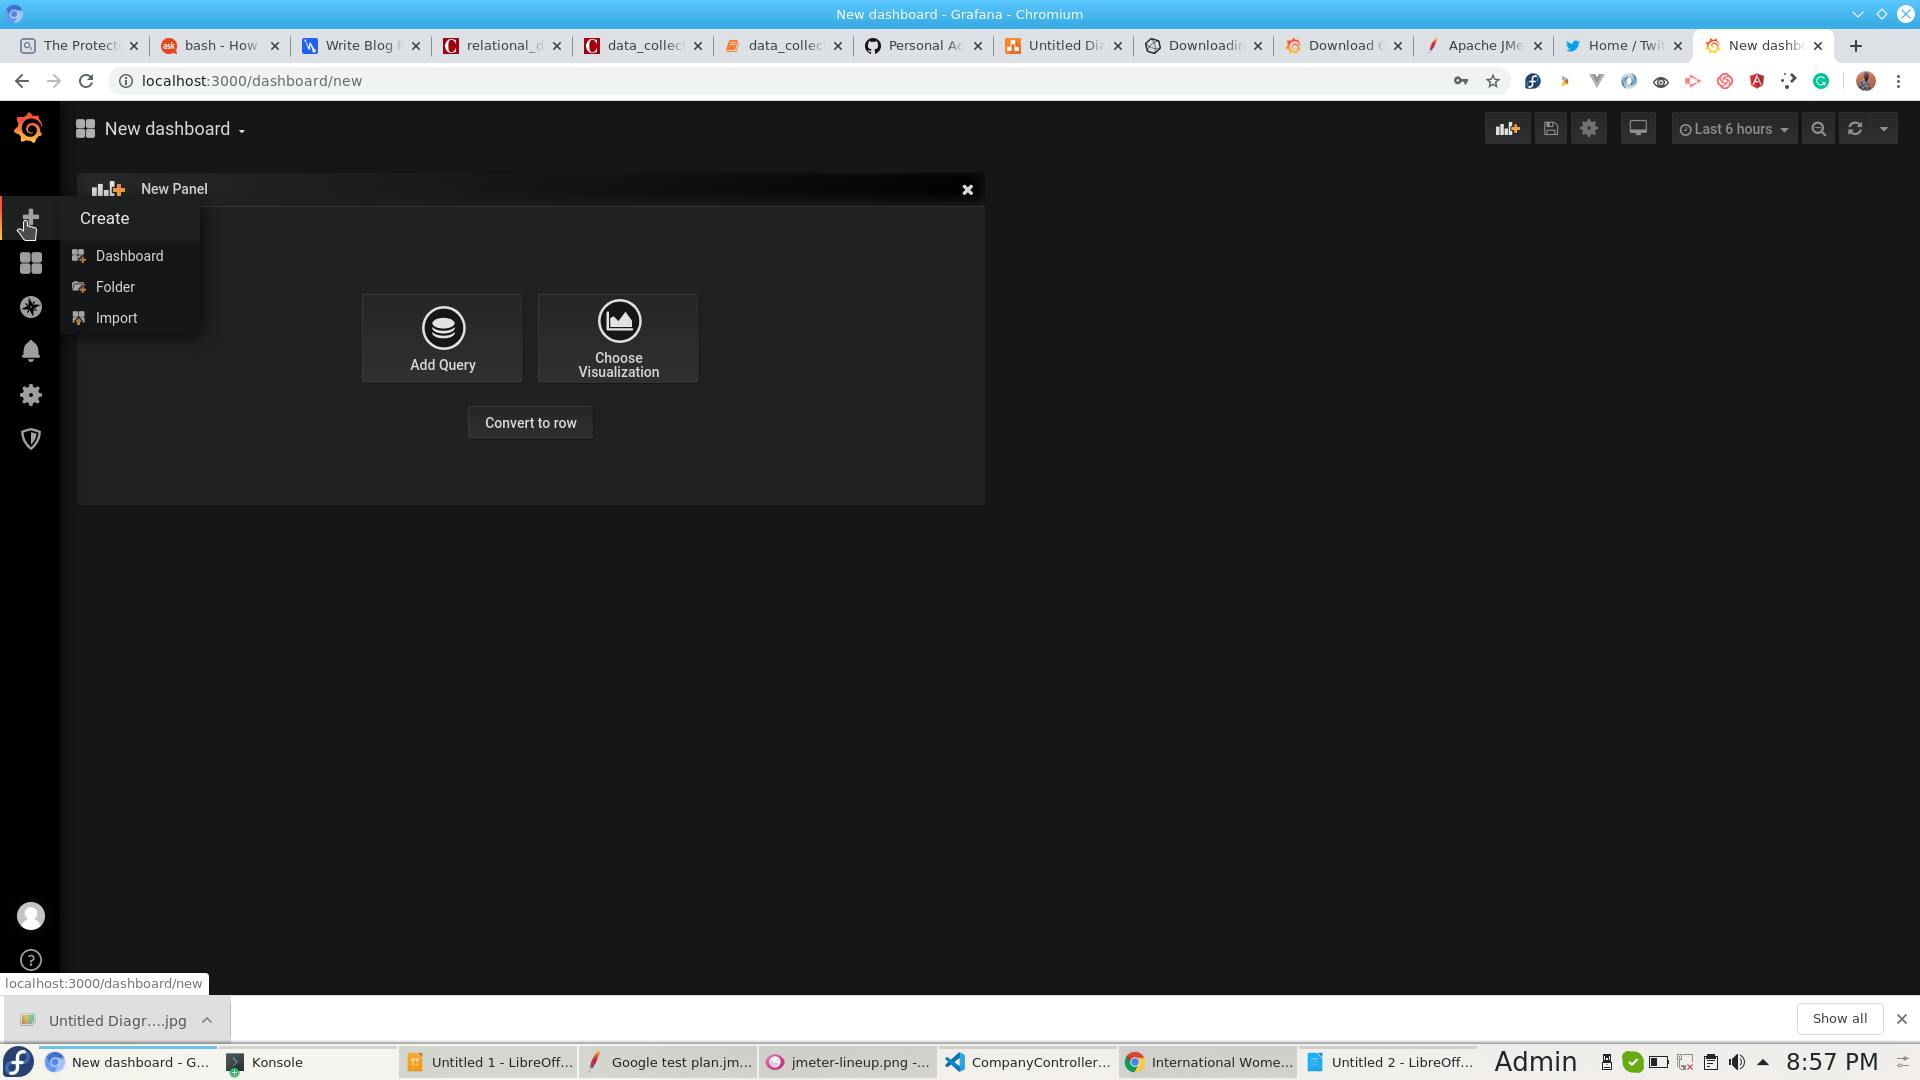
STEP 10: Connect to Grafana. Usually, it is available on localhost:3000 by default. Login with the credentials you created when installing it. Now, we can create a dashboard for our JMeter test. Click on the ‘+’ sign on the left and select the dashboard.
STEP 11: Click on ‘Add Query’ to add influx DB. From the ‘Query’ dropdown select influx DB as the data source and that’s it! Grafana will show your test data in the graph! You may modify the default query to soothe your visualization.
You learn more about querying Grafana from the documentation.